Woofer Design Presentation:
Woofer Design using non-linear BL(x) curves
Drivers can either be designed for target Thiele-Small (TS) parameters or target system
response in several ways. The sound quality depends on excursion, shape of the BL(x)
curve, Voice Coil offset, amount of steel, compliance linearity, high power stability and so
on. In addition there is a demand for cost savings as the material prices have increased
drastically.
Practical design examples considering all these aspects will be given.
Design for target TS parameters
An example of a woofer design using target Thiele-Small (TS) parameters is illustrated in
this section. The following target specifications are given:
Target Specifications:
Woofer 6.5 inch
Nominal impedance 8 ohms
Total Qts ~0.3-0.35
Resonance frequency Fs <40 Hz
Xmax ~5mm
(Vas <40 liters)
Magnetically Shielded
Available driver components:
1. Voice coil:
a. ø25.60mm ID
b. DCR (Re)=6.2 ohms
c. 0.05 mm Kapton former/bobbin
2. 6.5” paper Cone + Sur.:
a. 13.11cm diameter
b. Cone Fo=22.5 Hz
c. (Cone + dust cap + ½surround + ½spider =8g)
3. Top plate:
a. ID 27.20mm
b. 5mm thickness
2
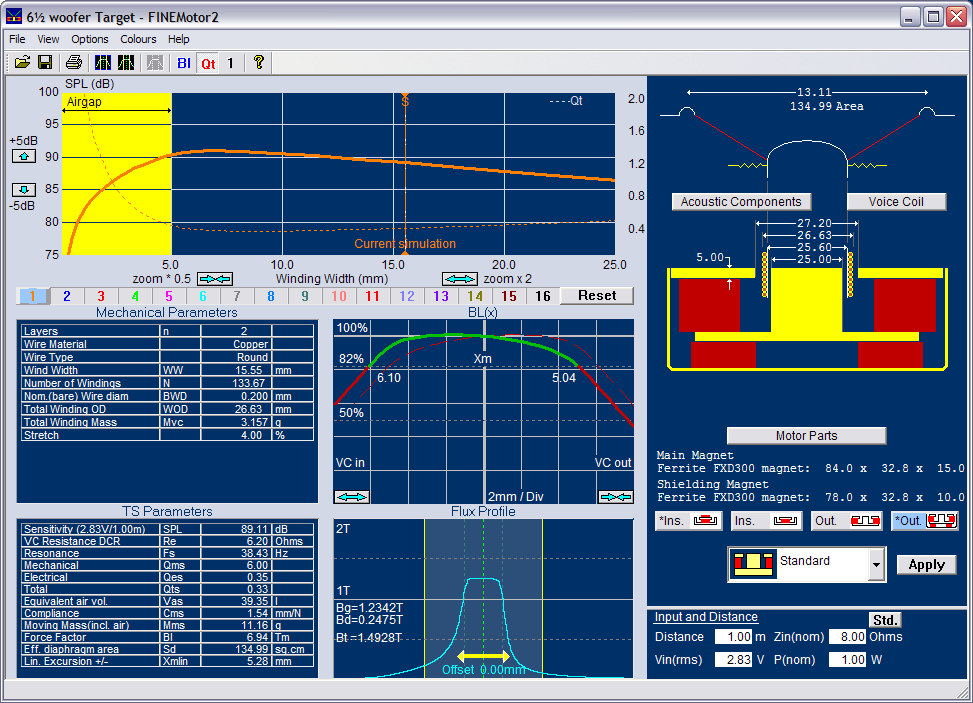
Figure 1 – Initial FINEMotor solution
One solution to satisfy the target specifications is simulated in FINEMotor, shown in Fig. 1:
A 2-layer Copper Voice Coil (VC) having a winding width of 15.5mm is centered in the
5mm top plate, and is surrounding a normal straight pole-piece with no extension. The
shielded ferrite motor is using an 84x33x15mm magnet.
The calculated TS parameters fit well with the target, giving Qts=0.33 and Fs~38Hz with a
VC overhang of 5.28mm. However all is not perfect, which is illustrated by the BL(x) curve
(part of Fig.1). This curve is simulating BL as a function of the VC travel (x), where the
green part indicates when BL>82% of the value at the resting position, which is the
known condition for ensuring low distortion. The dashed red curve is the mirror curve
about the vertical axis, and indicates whether BL(x) is symmetric about the Y-axis,
corresponding to in/out of the motor system.
In this case the BL(x) curve is reasonably flat, but not symmetric around the Y-axis. In
such cases the average Voice Coil position will shift due to the rectifying effect produced
by this BL non-linearity. The actual flux profile through the air-gap is shown below, and is
clearly not symmetrical, but being higher in the left side. This is caused by the magnetic
stray field, which is increased below the air-gap due to the straight pole piece,
encouraging the flux lines.
3
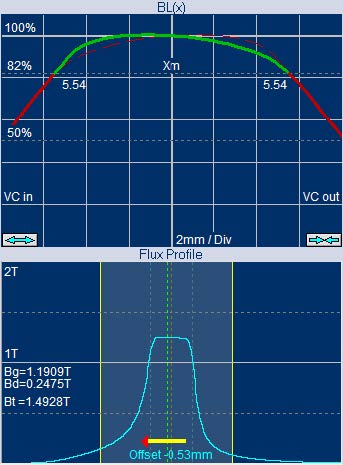
Figure 2 – BL(x) with 0.53mm VC offset
In Fig. 2 the Voice Coil rest position has been moved by dragging the VC 0.53mm into the
motor (in the flux profile window), which does increase the symmetry now giving an
Xmax= 5.54mm (at BL(x) = 82%) in both directions. However in such cases a DC offset
out of the motor may still happen above Fs. Further improvement will therefore have to
include changes to the shape of the flux profile/pole piece.
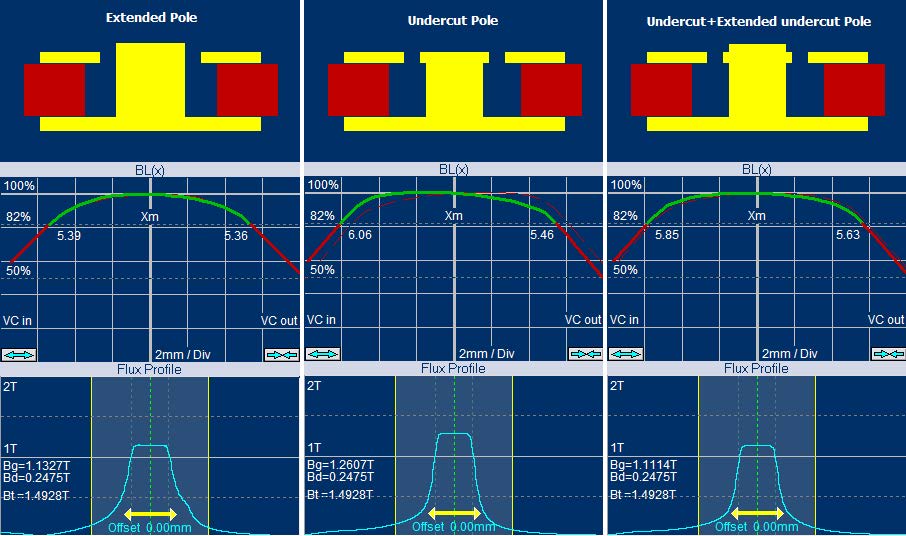
Figure 3 – BL(x) for 3 different Pole Geometries
4
Fig. 3 gives various ways to modify the geometry of the pole piece. Starting left the pole is
here extended to increase the stray field above the top plate, centre is an undercut pole to
minimize the stray field below the top plate, and right is a special combination of the two
by also undercutting the pole extension.
The extended pole provides a very symmetrical, but not quite flat BL(x) curve and high BL
because the stray field is well utilized, see Fig.4 (the flux profile in fig.3 has a “bump” on
the right side). The undercut pole concentrates the flux much better in the air-gap, but is
not as symmetrical and the BL is lower due to less stray flux. The special undercut
combination gives an extremely symmetrical and very flat BL(x) curve, however with a
lower BL.
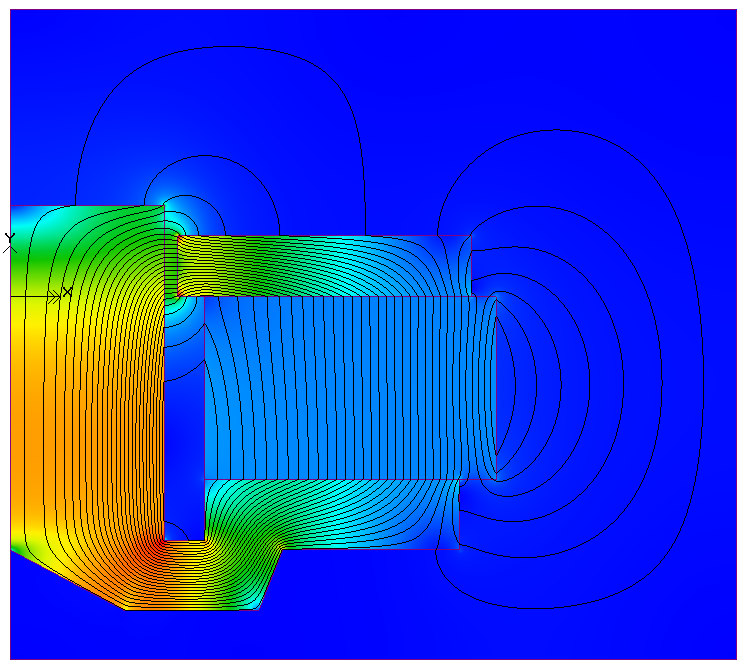
Figure 4 – Magnetic FEA of extended Pole geometry
In this case the extended pole piece is chosen; the pole extension is here 2.5mm, which is
half of the top plate thickness. The available maximum VC travel (x), indicated by the
green BL(x) part, is 5.36mm (when BL>82% of the value at the resting position), which is
even slightly more than the linear Xmax (VC overhang). The calculated TS parameters in
Fig.1 are unchanged and fit the target. Shielding was added to the motor, while keeping
the same TS parameters.
The maximum flux density in the top plate is 1.49T, which is far from saturation (given by
Bt =1.49T in the flux window). A thinner top plate is possible, but does not give better
performance.
Alternative Solution
Other non-linearities for the pole geometry will be considered later, but in the following
the woofer is designed for the target specs, using a 4-layer Voice Coil.
The 4-layer wire dimension, VC winding height and number of windings etc. is easily
calculated, but the air-gap diameter must be increased to accommodate the larger
winding outer diameter. The question is how much.
5
As a solution it is decided to use the same VC clearance as for the 2-layer VC, and let the
software calculate both the new 4-layer VC and the new air-gap flux, and then use those
data to calculate the new TS parameters.
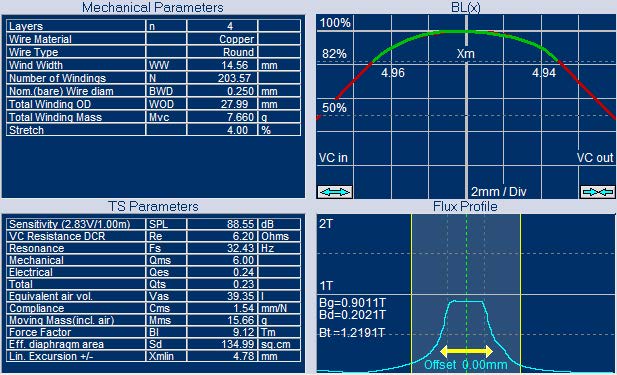
Figure 5 – First calculation with 4-layer VC (Extended Pole)
Fig. 5 gives the Voice Coil winding data for the 4-layer VC in “Mechanical Parameters” and
the corresponding calculated TS parameters below. The first observation is Qts = 0.23,
which is far too low. Fs is lower due to the increased VC mass. (The magnet operating
point given by Bd=0.2021T also gives reduced low temperature stability)
The reason for the low Qts is that BL suddenly increased from 6.94 to 9.12Tm, an increase
of 31%; despite the much lower flux density in the air-gap (Bg was lowered from 1.23 to
0.9T). The explanation is of course the increased number of windings of the 4-layer VC
(203 windings), compared to the 2-layer VC (133 windings), a 73% increase.
An easy fix is therefore to switch to a smaller 72x32x15mm main ferrite magnet (and also
a reduced size 60x32x10 shielding magnet) , which will give another solution of TS
parameters fitting the target, see Fig. 6 below. Qts is back to 0.33 caused by a lower BL
value of 7.50Tm. The Bd=0.2387T now indicates good low temperature stability.
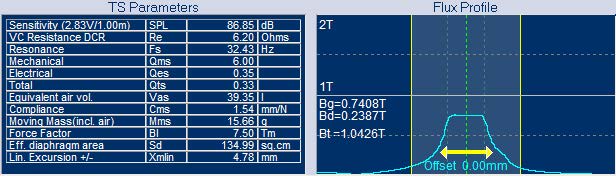
Figure 6 – Final 4-layer VC calculation fitting Target
Fig. 7 gives the new magnet and steel dimensions. The two smaller magnet sizes and
correspondingly less steel give a considerable cost saving.
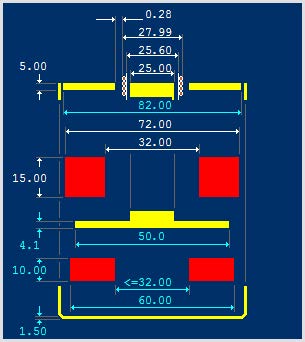
Figure 7 – 4-layer Magnet Parts
Considering that two different solutions to the same target TS parameters have been
found, it will be interesting to see how these drivers will perform in the intended 20 liter
bass reflex cabinet.
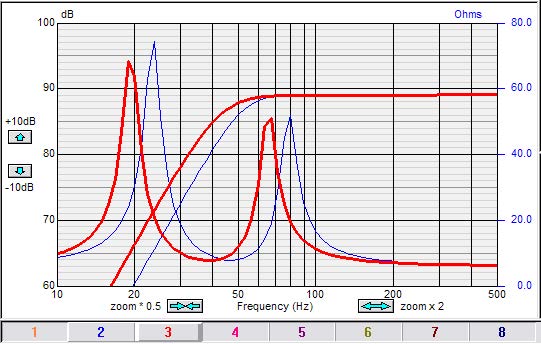
Figure 8- Bass Reflex responses of 2-layer VC___/ 4-layer VC___
Fig. 8 shows the response of the two drivers in the 20 liter bass reflex box calculated in
FINEBox. The blue response is the first 2-layer VC solution, tuned to Fb=48 Hz which
produces close to a maximally flat B4 response (actually QB3). The red curve is the
second driver solution with the 4-layer VC. In this case a lower tuning frequency Fb=39Hz,
gives a similar B4 response, however now with a considerable low frequency extension.
NB the red curve is normalized to the same level by raising it 2.2 dB, to compensate for
the lower sensitivity of the 4-layer VC version.
The conclusion is therefore that the 4-layer VC version is attractive due to the low
frequency extension and a considerable cost saving, however accepting the 2 dB lower
sensitivity, mostly caused by the increased mass. See also later regarding VC inductance.
Compliance
So far only the BL non-linearity has been considered. The two other main driver nonlinearities
are compliance and inductance of the Voice Coil.
The total compliance has contributions from both the surround and spider. Usually the
spider is much stiffer than the surround (lower spider compliance), and the spider is
normally stretching out providing a mechanical limitation of the excursion. A normal halfroll
surround is quite linear, but with a relatively sharp increase in stiffness when it reaches
its maximum excursion.
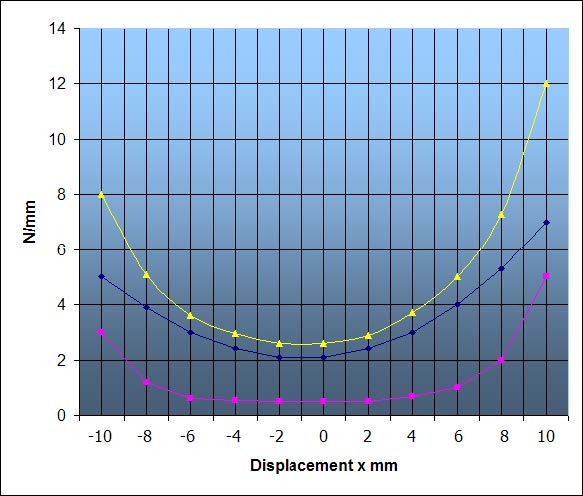
Figure 9 – Stiffness (Spider___/ Surround___/Total___)
A typical example of suspension stiffness curves is shown in Fig. 9. The blue curve is the
spider stiffness and the magenta curve is the surround, being much softer, but increasing
very much at maximum negative and positive travel. The total stiffness is shown in yellow.
If the spider is capable of much more excursion than the surround, an annoyingly bad
sound may be the result when the surround suddenly is stretching out. Usually the
surround is much stronger than the spider, especially a half roll rubber surround, but many
designs intentionally use a kind of soft limiting spider, to avoid the sudden sharp sound
from the surround.
The symmetry of the compliance is the most important. A symmetrical curve will prevent
the rectifying effect which causes a DC-component giving distortion and reducing the
useable Xmax. The spider must be flat, without any cup or similar, as that will exactly
produce the offset we are trying to prevent. If a part of the corrugations of the spider is
effectively stiffened by glue, the remaining active spider part must be symmetric from that
point.
Fig, 10 is an impedance measurement of a small 2.5 inch driver at 3 different input levels:
5, 0.5 and 0.05V. The resonance Fs is seen to vary very much with the input current,
which is another effect of the compliance non-linearity.
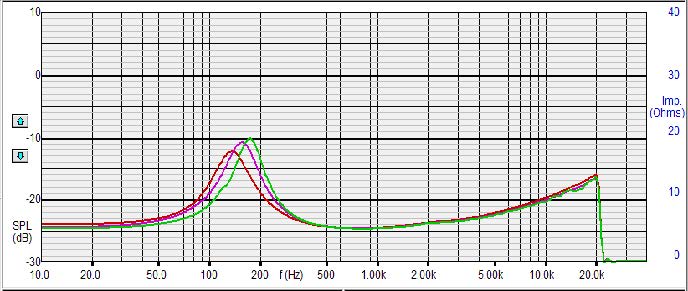
Figure 10 – Fs of 2½ inch driver measured at 5 / 0.5 / 0.05V Input
Qts is also known to be proportional to the resonance frequency Fs. Despite that it will be
relevant to find out what will happen to the low frequency response of the bass reflex
system, when Fs is increased by increasing the total stiffness (= reducing the compliance).
Fig. 11 gives the “Acoustic Components” where the current compliances are specified /
calculated. The current spider is close to 3 times stiffer than the surround.
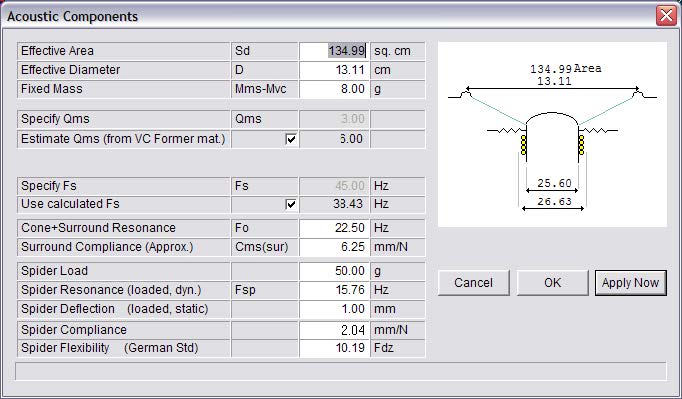
Fig. 11 gives the “Acoustic Components” where the current compliances are specified /
calculated. The current spider is close to 3 times stiffer than the surround.
Figure 11 – Compliance / Fs Specification
Fig. 12 shows the response of the 2-layer VC woofer in the 20 liter bass reflex box in blue.
The red response is the same driver, but with increased suspension stiffness giving Fs=
55Hz and Qts= 0.45, now tuned to Fb= 49Hz to give a very similar response compared to
the previous.
The VC excursion is reduced below Fb, giving more stability because the response is
controlled by the suspension stiffness in this region.
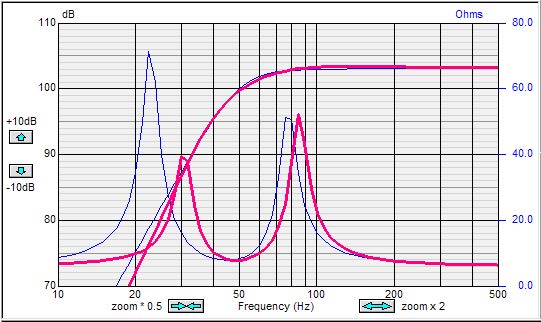
Figure 12 – 2-layer VC woofer in 20L Reflex box ___Fs=38Hz/ ___Fs=55Hz
The next Fig. 13 is a good example showing a 6.5inch/165mm woofer with a response
problem at 1500Hz. The surround was optimized by increasing the roll thickness, which
improved the response and increased the stiffness of the surround at the same time.
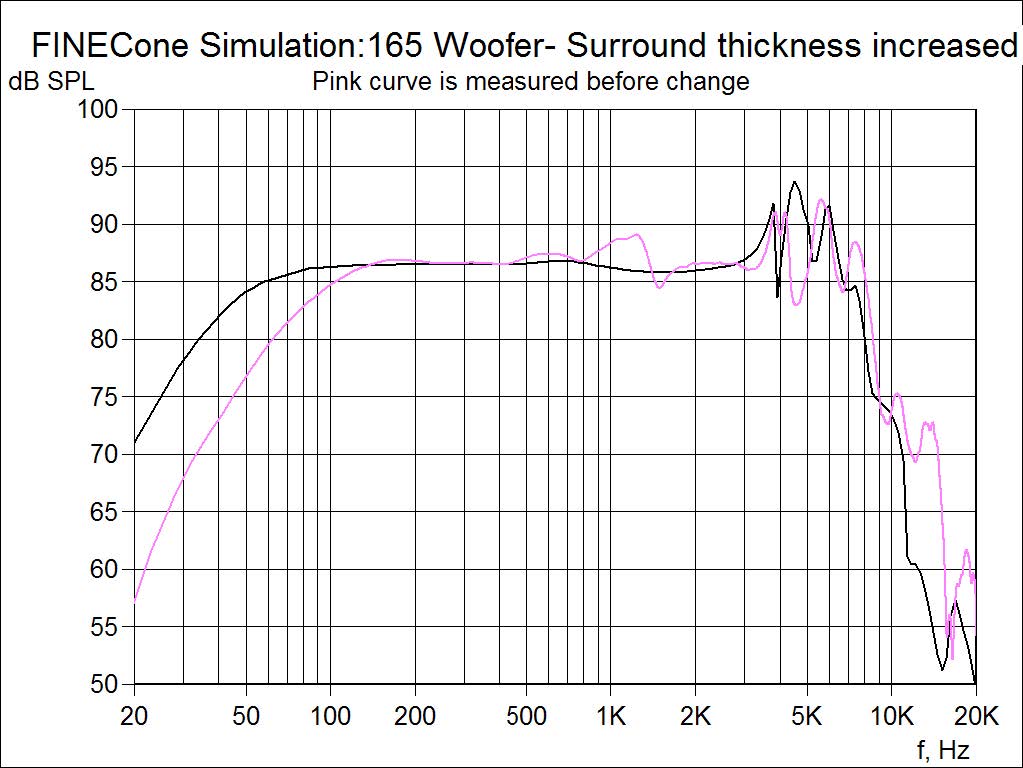
Figure 13 – FINECone Simulation of 6in woofer with changed Surround___ / standard___
The conclusion is that the standard Qts and Fs tuning formulas are not always good as a
design rule. Simulation gives many more options and the possibility of optimization of
components.
Voice Coil Inductance
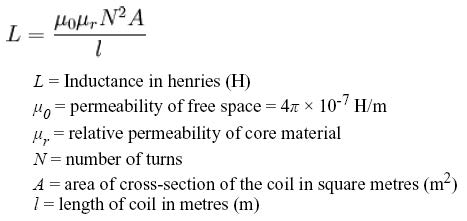
The basic inductance formula for a cylindrical coil is given:
When designing a driver Voice Coil the diameter and winding width are usually determined
by target performance plus power rating and costs. Therefore the designer needs to
consider the number of windings and the amount of steel in order to control the VC
inductance.
The symmetry of the induction is largely determined by the amount of steel inside the VC,
both at rest and at the extreme positions in/out of the air-gap.
In the beginning an extended pole piece was chosen, which will also help to reduce the
variation of VC induction, because the amount of steel inside the VC is less dependent on
the actual position of the VC. But the steel may also be minimized by undercutting the pole
piece under and above the top plate.
Actually an inside magnet/Neodymium motor configuration usually has much less steel
close to the VC and therefore less induction making it an interesting solution in many
cases, especially with a top neo magnet, see Fig. 14
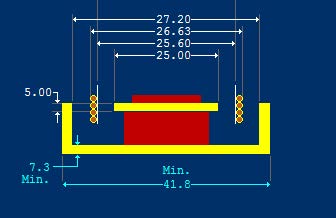
Figure 14 – Inside Neodymium motor with minimum Steel
To illustrate how the inductance varies with VC excursion, the impedance of a woofer
having a 4-layer VC and pole piece with no extension or undercut was measured, see Fig.
15. There is a considerable variation of the impedance at mid- and high frequencies,
when the VC is moved up/down in the gap, which is a significant source of distortion.
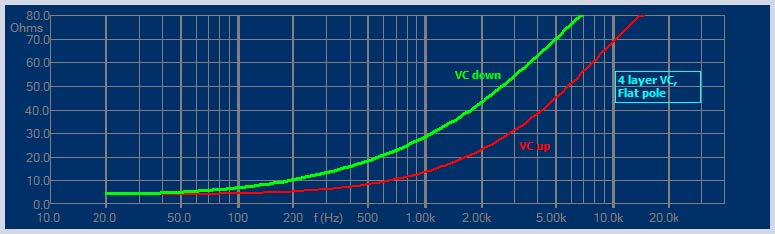
Figure 15 – Measured 4-layer VC Woofer Impedance, VC up / down
The next Fig. 16 shows the measured impedance of a woofer having a 2-layer VC,
undercut pole and a flat spider. The little difference between VC up and down promises
low distortion.
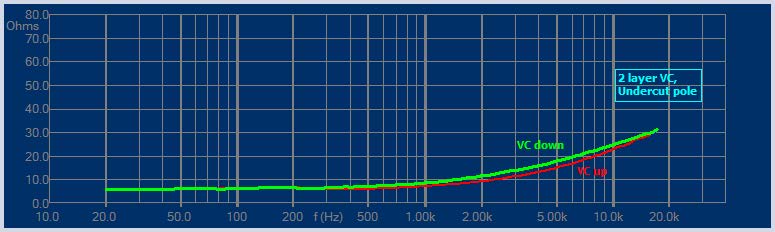
Figure 16 – Measured 2-layer VC Woofer Impedance, VC up / down
In the inductance formula the number of windings is squared (N^2), indicating that this
factor has the greatest influence on the inductance. This could also explain why the 2-layer
VC has less inductance. The 4-layer VC had 203 windings compared to the 2-layer VC
with just 133 windings.
Therefore there exists another method to decrease the VC inductance. The normal Voice
Coil winding using round wires is only effectively using a part of the space occupied by the
winding. A square wire will in theory come close to 100%. A real flat wire Voice Coil will
still have a comparatively higher BL, and less windings, especially when wound in 1 layer
with a rather flat wire, see the sketch in Fig. 17.
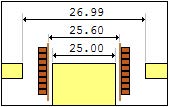
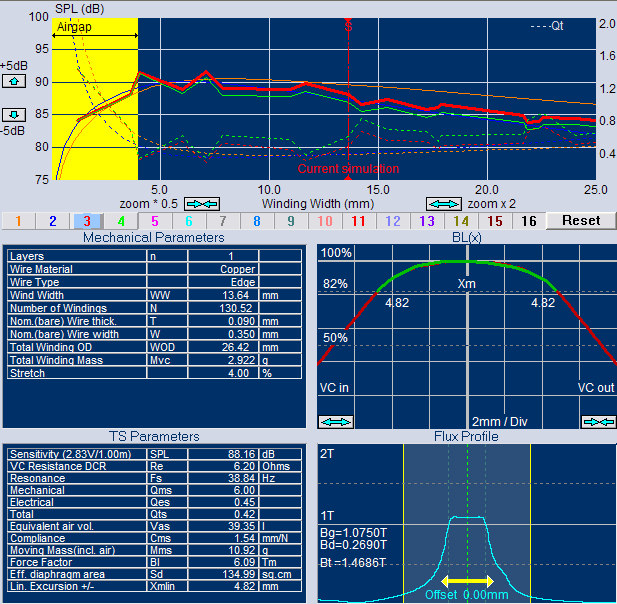
Figure 18 – Third Woofer Solution with 1-layer Flat Wire VC
The flat wire 1-layer VC is calculated in Fig. 18, indicated by the red simulation curve in the
upper window. The actual wire is 0.09×0.35mm and the number of windings is down to
130, similar to the first 2-layer VC, which will ensure a low inductance.
The TS parameters are close to the target even with the smaller 72x32x15mm ferrite
magnet, which is caused by the better fill factor of the flat wire.
In conclusion the low inductance designs are especially suited for mid-woofers and
midranges, where the inductance distortion may be dominating. The multi-layer VC
designs are well suited for subwoofers, however the BL and compliance symmetry is
always important to avoid DC components and thereby distortion in the signal.
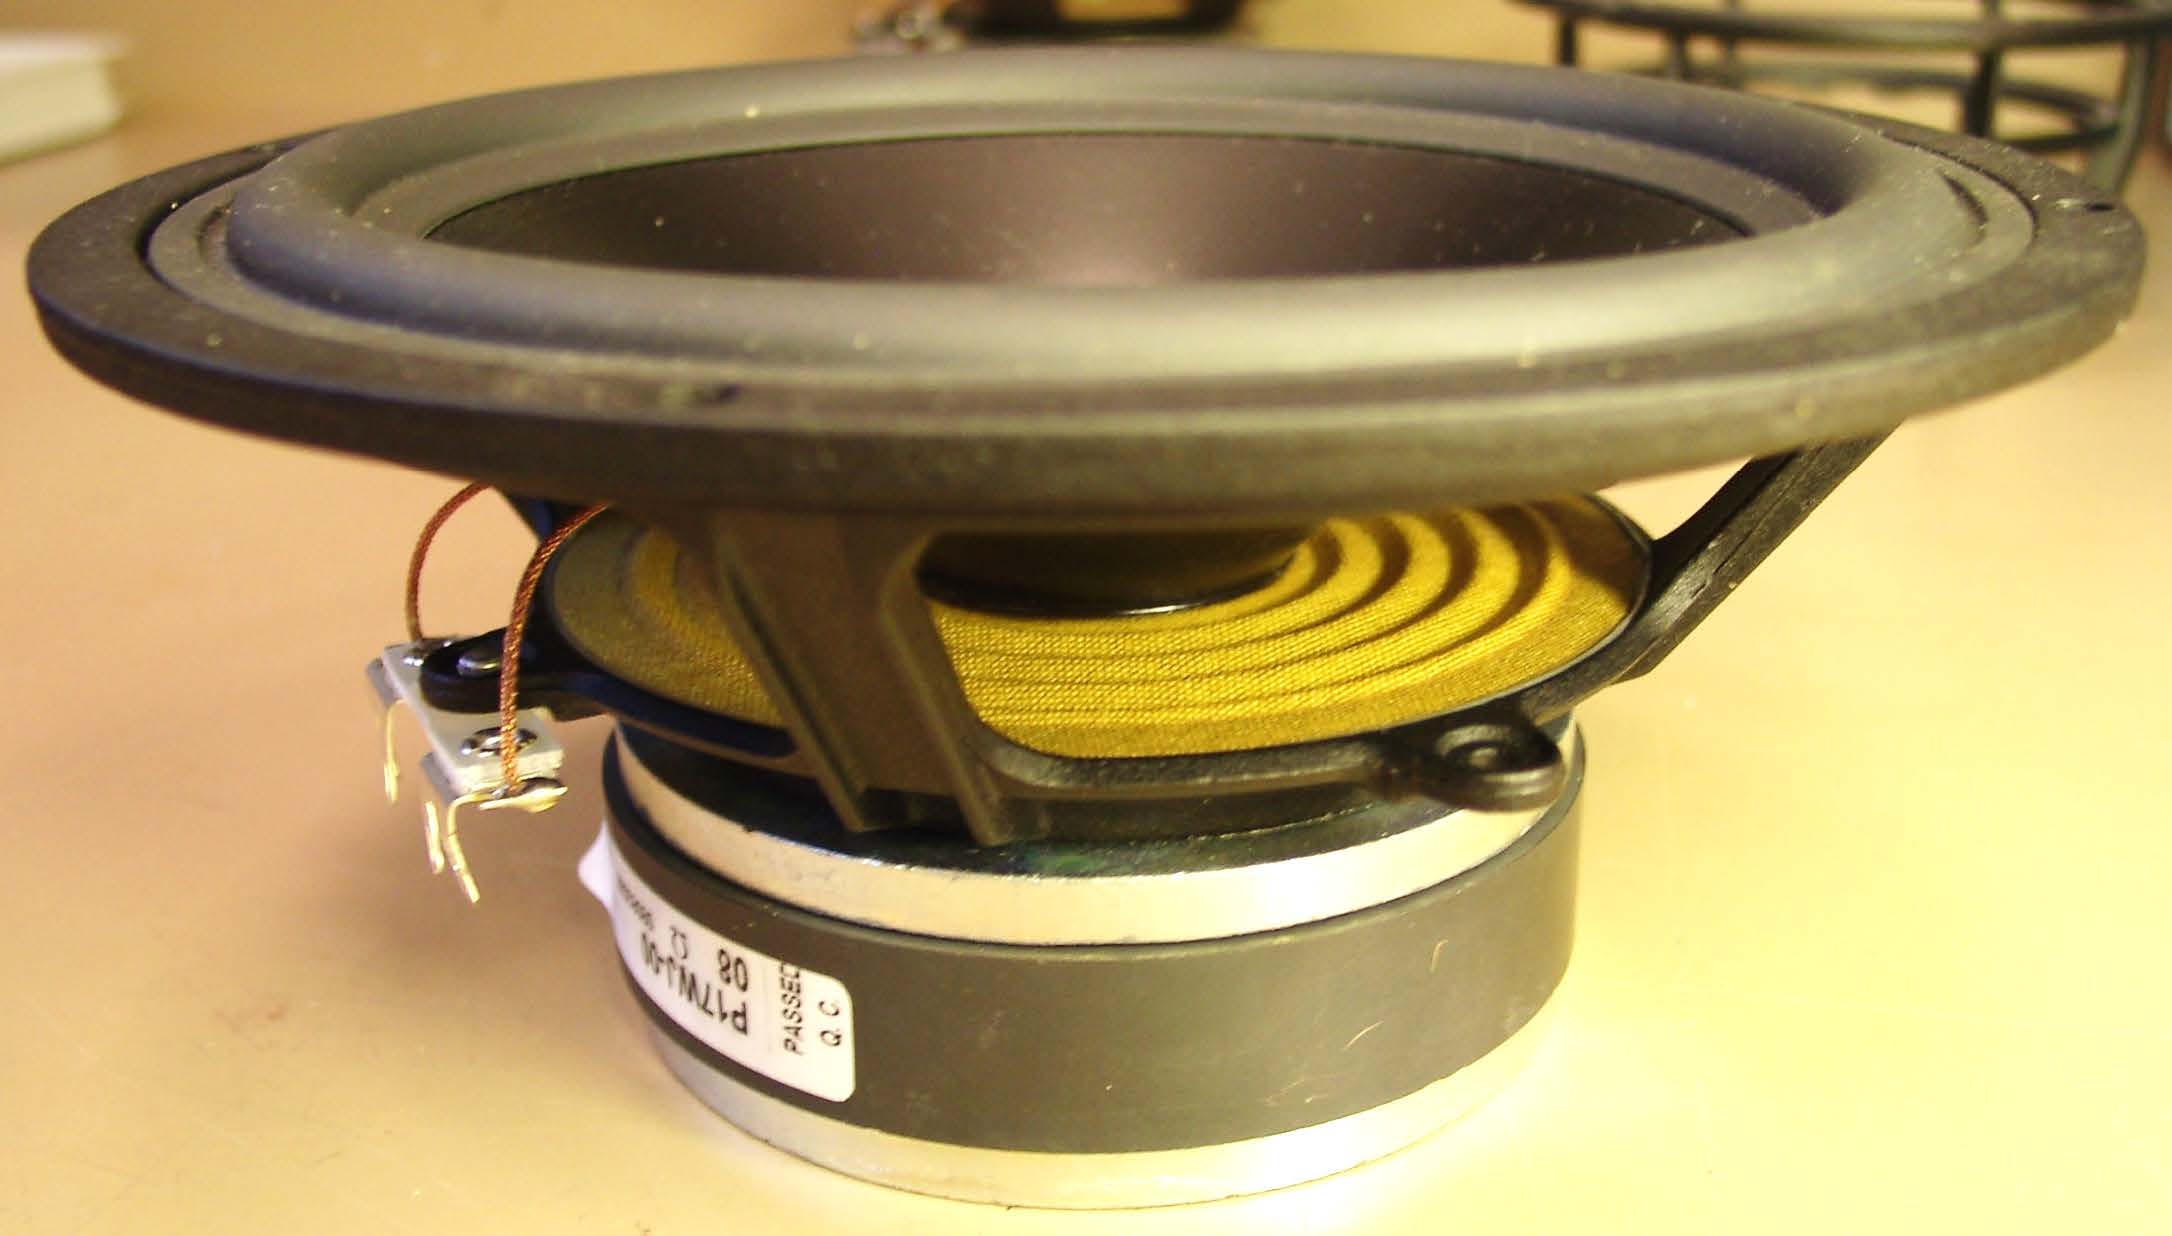
Figure 19 – Vifa Woofer P17WJ from 1987
The picture in Fig. 19 is the Vifa 6.5 inch P17WJ woofer, which was designed in 1987. The
impedance curve in Fig 16 with the up/down VC position was actually measured from this
driver. The 2-layer VC and undercut pole is the explanation for the little impedance
variation.
Note the flat spider, which is progressive due to the sharp corrugations. There are exactly
an integer number of full wave corrugations when the neck glue is assumed stiff.
Compliance with Gravity.
The total driver compliance will actually determine how far a woofer cone/VC will sink
when placed horizontally. Therefore high compliant woofers with heavy cone/VCs may
sink more than 1 mm. This is a simple calculation, actually the spider calculations in Fig.
11 can also be used here. Input the moving mass Mms as load mass, and the Cms as
spider compliance, and the calculated deflection shows how many mm the cone will go
down.
This was the reason for turning a large number of high compliant woofers upside down at
Vifa many years ago. The cones had sunk too far while kept in stock.
Peter Larsen
LOUDSOFT
APPENDIX
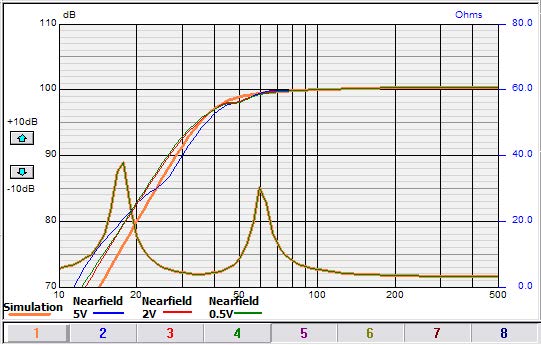
Figure 20 – 8in Bass Reflex System @ 0.5 / 2 / 5V Input
Finally an 8inch bass reflex subwoofer system was simulated. Following a real system was
measured at different input levels 0.5, 2 and 5V to check the response variations, Fig. 20.
The 0.5 and 2V responses are quite close to the simulated in the pass-band. Only the 5V
curve is a little different mainly at very low frequencies below the cut-off frequency. The
compliance curve of this driver was quite symmetrical but still quite progressive. Still the
pass-band response was little affected by the suspension non-linearity.
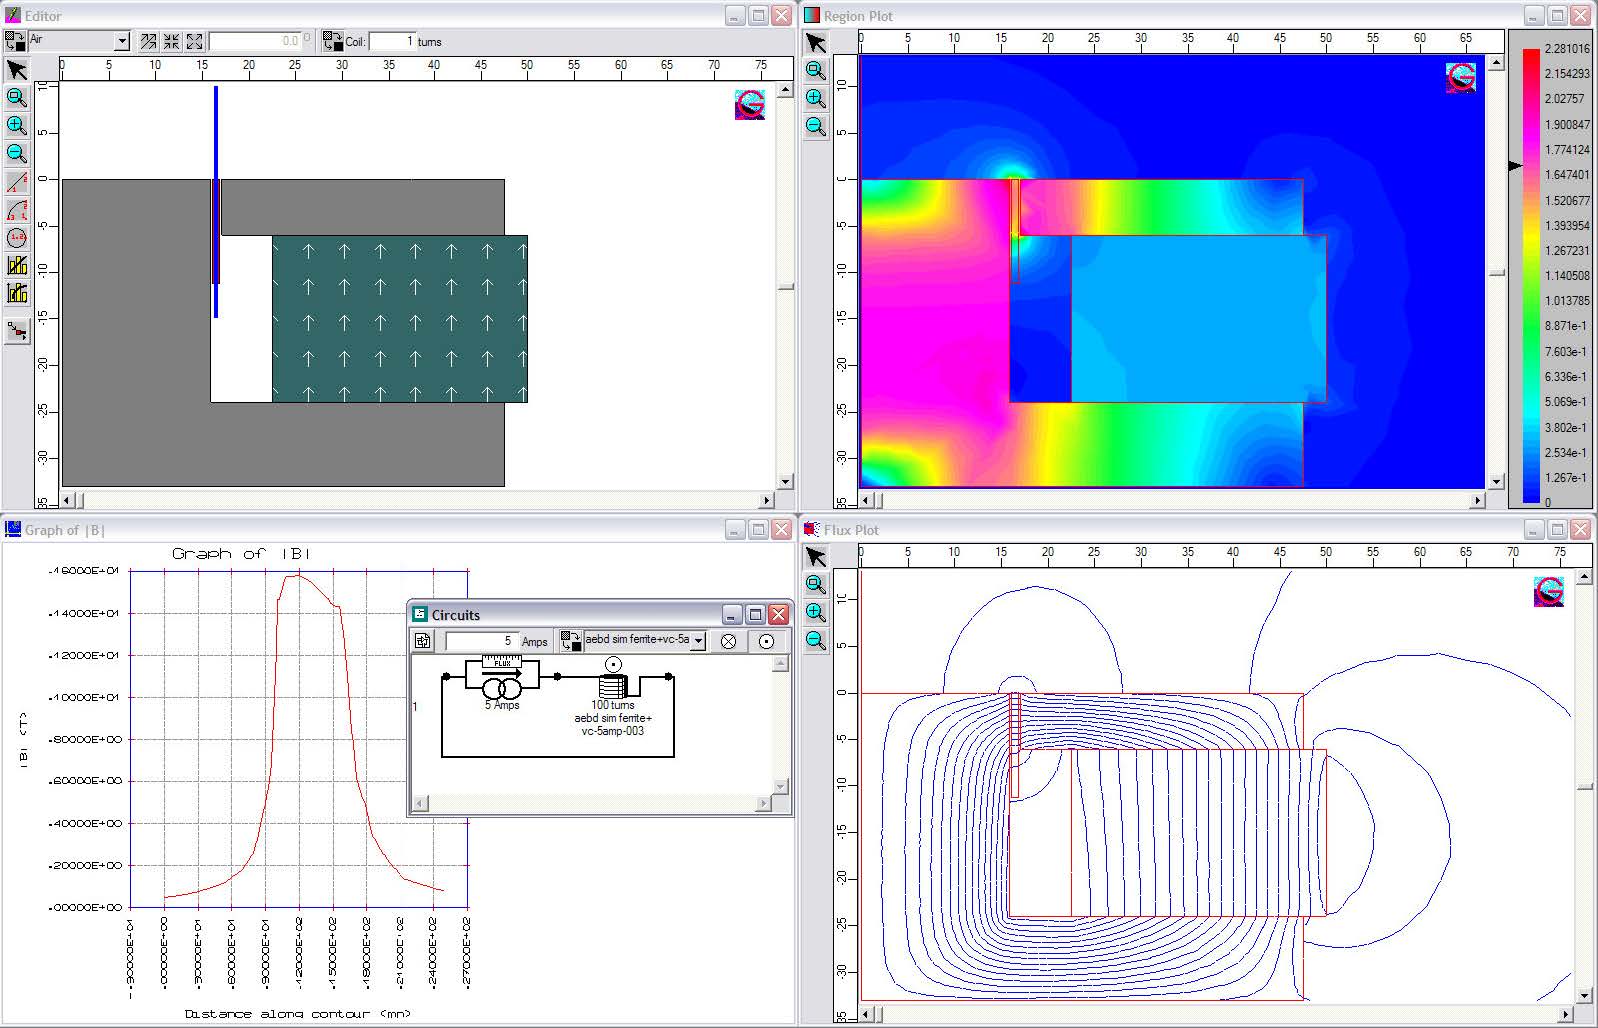
Figure 21 – High Current woofer Flux FEA Calculation
The last Fig. 21 shows a magnetic Finite Element Calculation of a high flux density ferrite
motor with a Voice Coil having 100 windings while being run at 5 Amps peak current.
There is no sign of demagnetization or saturation in the steel. This suggests that such
phenomena may only happen in very extreme cases.
References
1. R. H. Small, Direct-Radiator Loudspeaker System Analysis, J. Audio Eng. Soc., vol.
20, pp. 383. 395 (1972 June).
2. R.H. Small, Closed-Box Loudspeaker Systems, Part I: Analysis, J. Audio Eng. Soc.,
vol. 20, pp. 798. 808 (1972 Dec.).
3. N. Thiele, Loudspeakers in Vented Boxes: Part I and II, in Loudspeakers, vol. 1
(Audio Eng. Society, New York, 1978).
4. W. Klippel, Nonlinear Large-Signal Behavior of Electrodynamic Loudspeakers at Low
Frequencies, J. Audio Eng. Soc., vol. 40, pp. 483-496 (1992).
5. E. R. Olsen and K.B. Christensen, Nonlinear Modeling of Low Frequency
Loudspeakers – a more complete model, presented at the 100th convention Audio
Eng. Soc., Copenhagen, May 11-14, 1996, preprint 4205.
6. W. Klippel, “Diagnosis and Remedy of Nonlinearities in Electro-dynamical Woofers,
presented at the 109th Convention of the Audio Engineering Society, Los Angeles,
September 22-25, 2000, preprint 5261
7. P. Larsen, Better Speaker Designs in practice, LOUDSOFT, Oct 2007
8. P. Larsen, FINEMotor 2008 Tutorial, LOUDSOFT, Nov 2008
9. http://en.wikipedia.org/wiki/Inductance